


Cloud Cost Audit & Dashboard Template — Board-Ready Cloud Spend Visibility for U.S. BFSI
Five pre-built dashboard views that give CIOs and CFOs real-time visibility into cloud spend — TCO per environment, ROI per workload, cost-per-transaction, Budget Variance Ratio, and live deviation alerts — structured for BFSI board reporting and compliance documentation.
- Pre-built dashboard structure — no setup from scratch; connect your cloud billing export and the five views populate automatically
- BFSI benchmark overlays — each KPI view includes 2025 industry averages for U.S. BFSI to contextualize your actual spend
- Board and audit committee format — executive summary view with variance callouts, trend lines, and compliance-aware annotations
- Configurable deviation alerts — Budget Variance Ratio thresholds trigger alerts before the billing cycle closes, not after
- GLBA and FFIEC aware — compliance cost annotations for storage lifecycle and egress monitoring built into the template structure
Instant access. No spam. Softenger will never sell or share your information.
By submitting, you agree to Softenger’s Privacy Policy. You may unsubscribe at any time.
Template on its way
Check your inbox — we’ve sent the Cloud Cost Audit & Dashboard Template to your work email. Didn’t receive it? Check your spam folder or contact us.
Every Metric a U.S. BFSI Board or Audit Committee Expects to See
The template is structured around five specific cloud cost KPIs — each one chosen because it bridges the gap between technical cloud billing data and the business-language reporting that CFOs, boards, and regulatory examiners can act on.
Total Cost of Ownership (TCO) per Environment
The complete cost view across cloud platforms — not just compute, but storage, egress, licensing, support, and compliance-mandated logging combined. Segmented by environment type (production, dev/test, AI/ML, data) so the board can see where each dollar is allocated — and where growth is concentrated.
ROI per Workload
Cost-to-value ratio by workload — showing which cloud investments are generating measurable business return and which are consuming budget without traceable output. Particularly powerful for justifying AI/ML spend to finance teams.
Business Value ÷ Cloud Cost = ROI RatioCost-per-Transaction
Unit economics for financial services workloads — connecting cloud spend to the operational throughput it supports. Gives CFOs a comparable metric across reporting periods and enables direct cost-to-income ratio contribution from IT.
Total Cloud Cost ÷ Transaction Volume = CpTBudget Variance Ratio
Actual vs. budgeted cloud spend — tracked continuously, not just at month-end. Configurable deviation thresholds trigger alerts when variance exceeds defined tolerances, allowing finance teams to intervene before the billing cycle closes.
(Actual − Budget) ÷ Budget × 100 = BVR%Real-Time Deviation Alerts
Configurable spend thresholds across workloads, environments, and cost categories. When AI/dev spend spikes, egress fees cross a compliance threshold, or storage growth accelerates unexpectedly — the alert fires before it becomes an invoice surprise.
Alert if Spend > Threshold × Configured ToleranceThe Dashboard That Works for CIOs, CFOs, and Compliance Teams — Simultaneously
The template is designed to serve three distinct stakeholder groups with different data needs — without requiring three separate reports.
Board and QBR Reporting
The executive summary view produces a board-ready slide with TCO trend, workload ROI summary, and BVR — giving directors the context to question or approve cloud budget decisions without requiring a technical briefing.
Cost-to-Income Ratio Contribution
The cost-per-transaction and workload ROI views feed directly into the IT cost-to-income ratio that CFOs track. Finance teams can finally see cloud spend as a business metric — not just a line item in the infrastructure budget.
GLBA and FFIEC Audit Preparation
The compliance-annotated cost views document that storage lifecycle policies, egress controls, and budget deviation monitoring were active — producing the evidence trail that technology risk examiners require.
What the Dashboard Measures Against — 2025 Industry Baselines
The template includes 2025 U.S. BFSI industry average overspend data as benchmark overlays for each dashboard view. When your TCO or BVR deviates from these baselines, the template highlights it — so the gap between where you are and where you should be is visible without calculation.
These benchmarks are the same data points that inform Softenger’s free BFSI Cloud Audit — when you book an audit, your template output becomes the input for a specialist-led gap analysis.
| Cloud Spend Category | Avg. Overspend (2025) | Optimized — With FinOps |
|---|---|---|
| AI & Dev Workloads | +18% | –20% after rightsizing |
| Storage & Egress | +25% | –15% after automation |
| Governance Gap | +30% | –25% after FinOps adoption |
Source: Softenger BFSI Cloud Cost Analysis 2025, based on managed infrastructure engagements across U.S. financial institutions.
The Dashboard Is Step One of the Path from Overspend to Controlled ROI
Cost visibility is a prerequisite for every other FinOps improvement. You cannot rightsize workloads you cannot see. You cannot govern spend you cannot measure. The dashboard template gives you the visibility layer — the FinOps roadmap below shows what comes next.
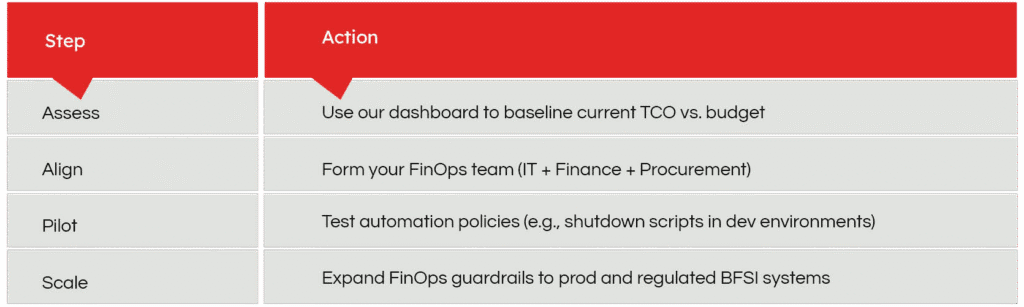
FinOps Roadmap — Dashboard visibility is the foundation of every subsequent cost optimisation action
Built with BFSI Compliance Requirements in Mind
Every dashboard view includes compliance-aware annotations — storage lifecycle cost tracked against GLBA data retention obligations, egress monitoring aligned to FFIEC audit log requirements, and budget deviation logging structured for technology risk examiner review.
Cloud Cost Control for Regulated Financial Institutions — Since 1999
Softenger delivers remote infrastructure management, FinOps consulting, and real-time cloud cost control for regulated industries. Our U.S.-focused BFSI solutions blend 24×7 support, transparent metrics, and compliance-aligned governance — built specifically for environments where cloud spend and regulatory exposure are inseparable.
After downloading and deploying the dashboard, CIOs and CFOs can book a free 30-minute BFSI Cloud Audit with Softenger’s cloud cost specialists — your dashboard numbers, our benchmarks, and a specific 90-day action plan.
- FinOps governance and steering committee setup — chargeback model, KPI framework, GLBA aligned
- AIOps-driven rightsizing across production, dev/test, and AI workloads — multi-cloud
- Compliance-aligned cloud cost controls — storage lifecycle, egress monitoring, deviation alerting
- Free U.S. BFSI Cloud Audit — benchmark current spend, identify top three optimisation opportunities
Common Questions
-
The template includes five pre-built dashboard views: TCO per environment (total cost across all cloud platforms segmented by workload type), ROI per workload (cost-to-value ratio), cost-per-transaction (unit economics for financial services), Budget Variance Ratio (actual vs. budget with deviation alerting), and real-time deviation alerts (configurable spend thresholds). All five views include 2025 U.S. BFSI industry benchmark overlays and compliance-aware annotations for GLBA and FFIEC requirements.
-
The template connects to AWS Cost Explorer, Azure Cost Management, or GCP Billing exports — most CIOs and FinOps practitioners can populate all five core metric views in a single working session. The Budget Variance Ratio deviation alerts require threshold configuration, which typically takes an additional 30–60 minutes depending on your budget cycle structure and the number of environments being tracked.
-
The FinOps Readiness Self-Assessment benchmarks your governance maturity and identifies structural gaps — it tells you what to fix. The Cloud Cost Audit & Dashboard Template gives you operational visibility into your actual numbers — TCO, ROI, cost-per-transaction, and budget variance — in a format designed for board and compliance reporting. They are complementary: use the dashboard to see where your money is going, and the self-assessment to understand why your governance model is letting overspend happen.
-
The template includes compliance-aware annotations for BFSI environments. Storage lifecycle cost tracking is aligned to GLBA data retention obligations. Egress monitoring views are structured to support FFIEC audit log requirements. Budget deviation logs produce the evidence trail that technology risk examiners ask for. The template is not a compliance platform — but it produces documentation that supports compliance review without requiring a separate reporting process.
Ready to Take Your Dashboard Numbers Into a Specialist Review?
Download the template, populate it with your cloud billing data, then book a free 30-minute BFSI Cloud Audit with Softenger’s cloud cost specialists. Your numbers. Our benchmarks. A 90-day action plan.